Have you ever
wondered if it is even possible to build a successful algorithmic trading system
that works all by itself without human intervention? Well, the answer is YES! It is certainly
possible to build a successful trading system, but it involves a lot of effort
and a clear understanding of financial market fundamentals. Let’s discuss all
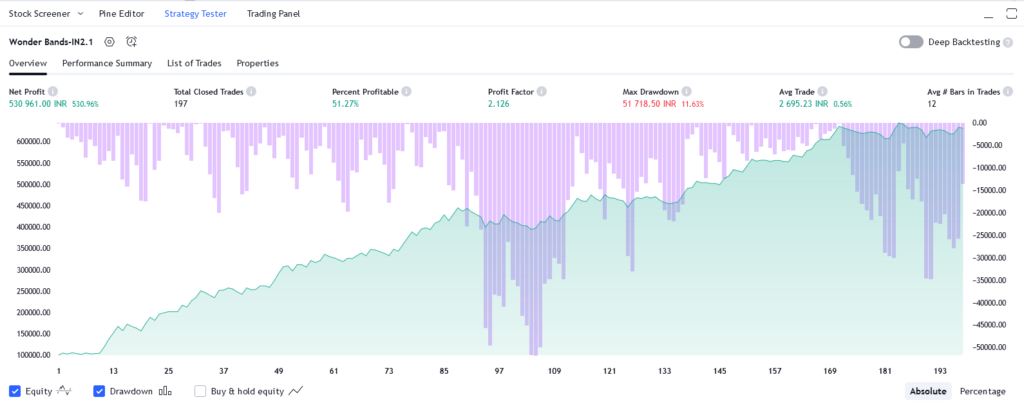
about it in this article with the results from one of my strategies as a case
study.
If you are
reading this article, you probably already know what algorithmic trading is and
its advantages over manual trading methods. I would say the most important
attribute is psychological control and emotional discipline. You can become
overconfident, over-excited by looking at some candlestick pattern, or luckily
if the market is behaving right as you have imagined it to go, but after a
while, the market ditches you with a hefty loss.
Conversely,
algorithmic trading systems are backtested on huge amounts of data, and
quantitative and technical analysis makes it even more robust. Quantitative
researchers include risk management systems to mitigate various types of market
risk in algorithmic trading strategies.
Even with all
other components such as risk management, backtesting, statistical analysis,
and quantitative analysis the most important thing in developing an algorithmic
trading system is choosing and developing a strategy.
Now what is a
strategy, this is a real question to ask. There are mainly three types of
strategies you can build momentum-based, trend-following, and mean reversion,
this depends on the properties of the price series you are working on, you must
analyze your price series whether it is momentum-centric, trend-following,
or mean reversion.
From my
experience, I can tell you that most of the indexes are mean-reversion in
nature, whereas individual stocks are either momentum-centric or
trend-following, or both. Now to find out whether your series is mean-reverting
or momentum-centric or trend-following, there are specialized methods that will
be out of scope for this article, but we will discuss them briefly.
Mean
reversion means that the price variation corresponds to the
disparity between the average price and the present price. We need to test the
stationarity of the price series which can be done using tests such as ADF,
Hurst Exponent, and Variance Ratio. Half-life of mean reversion measures how
quickly a price series reverts to its mean, and is a good predictor of the
profitability or Sharpe ratio of a mean-reverting trading strategy when applied
to this price series.
The momentum analysis
of a price series is two-fold time-series momentum and cross-sectional momentum.
Time-series momentum refers to the positive correlation between a price series’s
past and future returns. Cross-sectional momentum refers to the positive
correlation of a price series’s past and future relative returns. For a price
series that exhibits momentum-centric, we can use momentum-based technical
indicators such as the Relative Strength Index (RSI), Moving Average
Convergence Divergence (MACD), Average Directional Index (ADX), and Stochastic
Oscillator.
Similarly, it
goes with the trend-following strategies first you have to start with visual
inspection and use technical indicators such as supertrend, ADX and moving
averages.
Now I think
is the right time to give you a pro tip and that is you can build a great
strategy only by combining the standard technical indicators, I mean to say if
you are going to use each of these indicators alone you will never be able to
build a successful trading strategy. Think of all these standard technical
indicators to be “Do, Re, Mi, Fa, Sol, La, Ti” of the trading world,
like a musician you have to create a song out of these syllables, i.e. creating
a trading strategy all these technical indicators in a right mix and then you
will be able to see the real outcome.